BITCOIN STRUGGLES TO MAINTAIN $10,000: THE LAST TIME BITCOIN SEES 5-DIGIT PRICE IN SEPTEMBER 2019? BTC PRICE ANALYSIS


As you probably know, technical analysis is not always right, but it’s correct most of the time. Three days ago while Bitcoin was trading around $10,600, our last analysis title suggested another re-test of the $10,000 level, when everyone was bullish, we saw this leg down coming-up.

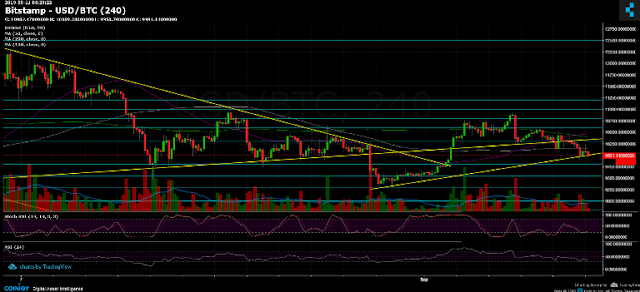
As you could notice, after getting rejected one more time by the crucial long-term descending yellow trend-line, started forming from the 2019 high at $13,880, Bitcoin plunged passed $10,000, marking the $9,880 support as its current daily low (as of writing this). This support is clearly seen on the following 4-hour ascending trend-line (marked yellow).

Looking at the bigger picture, the mentioned pattern of a substantial bearish triangle formation is still threatening the BTC chart. Of course, this can be invalidated at any moment; however, Bitcoin would need to break to the bullish side for it to take place and invalidate.

Simply put, the bigger picture from below is the crucial support line around $9,400, which is the last barrier before the triangle breaks to the downside. From the top, the triangles’ trend-line sits around the resistance level of $10,300 – $10,400. Hence, there is also a possibility of another leg up to the area mentioned above, before another final plunge.

Total Market Cap: $259 billion
Bitcoin Market Cap: $180 billion
BTC Dominance Index: 69.6%

*Data by CoinGecko

Key Levels to Watch


– Support/Resistance:
Bitcoin is now testing the critical $10,000 level as support. Nearby is the $9,880 support along with the 4-hour’s chart ascending trend-line. Further below lies $9600 (weak support level), before the crucial $9,400 level (the red ascending trend-line, the bottom line of the triangle). If broken down, Bitcoin is likely to produce a quick move down to $8,800 – $9,000 at first.

From the bullish side, the nearest level of resistance is the 100-days moving average line (marked white on the daily chart), around $10,250. Further above is the triangle’s descending line along with the 50-days moving average line (marked purple) at around $10,300 – $10,400. Above is the $10,500 – $10,600 zone.

– Daily chart’s RSI: After yesterday’s decline, the RSI is also standing on a decision point – the 44 levels. Overall, the RSI indicator tells the same bearish story of the Bitcoin’s price. Besides, since the stochastic RSI did make the mentioned cross-over at the overbought territory, Bitcoin lost almost $1,000 from its value.

– Trading Volume: Surprisingly, not a huge amount of volume followed the last move. Adding to the above, the daily volume is decreasing over time; this might tell on a coming-up huge price move.

BTC/USD BitStamp 4-Hour Chart


BTC/USD BitStamp 1-Day Chart


Comments

Popular posts from this blog

Bitcoin Hash Rate Hits All-Time High: Here’s How It Works And How It Affects The Price

Bitcoin intelligence, data, and analytics firm Glassnode found the Bitcoin hash rate hit a new all-time high over the weekend, ten days before the Bitcoin halving event. In other words, miners are putting more computational power into maintaining the Bitcoin network. Because miners must venture electricity and capital intensive computer processors to mine Bitcoin, the increase in hash rate is a bullish sign. It means miners are after the Bitcoin rewards they get from maintaining the network. And they’re venturing the resources to go after those rewards. Is The Bitcoin Hash Rate Correlated With The Price? In general, the Bitcoin price and the hash rate are not correlated. The price is what buyers and sellers agree to pay for one Bitcoin, and there are many factors – external and internal – affecting the price. However, there is a relation between the two. While the price goes up, it’s more profitable to mine, which likely to cause more miners to turn on their mining equ...

IN THE NEW DECADE, CRYPTO WILL BECOME ESSENTIAL LIKE EMAIL: SAYS TYLER WINKLEVOSS

It’s the start of a new decade, and industry famous twin Tyler Winklevoss, the co-founder, and CEO of cryptocurrency exchange and custodian company Gemini Trust, has shared his views on what the next ten years hold for crypto. According to Winklevoss, crypto is already becoming more than a niche technology and a form of money, and it will play an essential role in our daily life in the foreseeable future. “Today, crypto is still a niche technology and a form of money. It is not crucial to your everyday life the way email and other web applications are, but our thesis is that this will change — it’s already changing if you look close enough,” Winklevoss wrote. Winklevoss added that the decentralized nature of cryptocurrencies, which empowers individuals, will be the driving force within the new decade. Crypto will not only redesign the internet but will also redesign the financial and monetary systems to protect the rights and dignity of users, he said. The Winklevos...

Qatar Blocks Cryptocurrency Services Throughout The Gulf

As the new year begins, Qatar’s Financial Center, the nation’s regulatory authority, has issued a blanket ban on cryptocurrency-related services in the Gulf nation. The prohibition covers not only cryptocurrencies but “anything of value” that could substitute fiat currencies. Qatar Bans Cryptocurrencies The Qatari Financial Center, which is also the nation’s regulatory authority, has issued a statewide ban on cryptocurrencies and other digital assets that might substitute traditional fiat. Per the report , the authority stated that: “Virtual Asset Services may not be conducted in or from the QFC at this time.” It also reads that this goes for “Anything of value that acts as a substitute for currency, that can be digitally traded or transferred and can be used for payment or investment purposes.” However, it’s also worth noting that the ban doesn’t cover digital forms of securities or other financial instruments that are thoroughly regulated by the Regulatory Authority, ...